


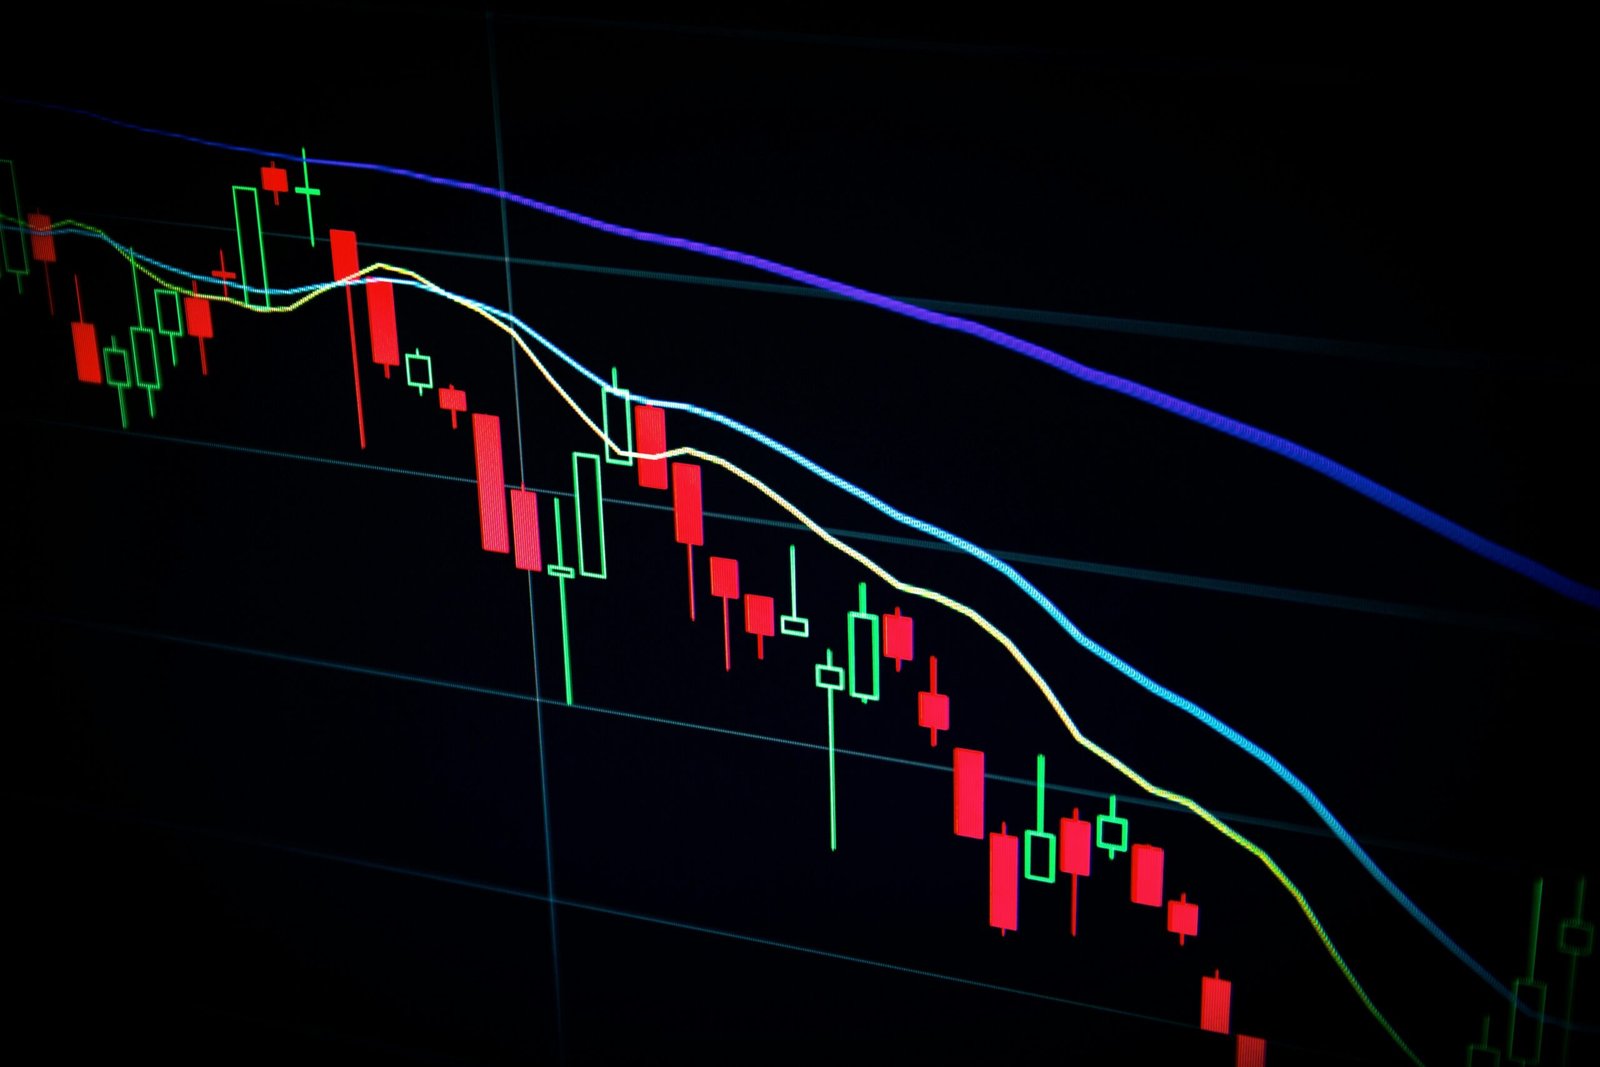
What is a liquidity sweep in trading when price pushes through a prominent level in a market, whether it be a past high or low where you would expect a large concentration of orders, briefly trade through or above that level, fill those orders or stop-losses and then either immediately rebound off that level, or continues past it at increased momentum. The crucial distinction here is it has to do with the relationship of price to liquidity; you can’t get it with a long wick.
It makes sense because a trader can make sense out of confusing market moves. An asset might go below a support level and begin to draw sellers, only to immediately reclaim support and then rally away from it. It could go past an all time high, draw out buyers from those breakouts and just continue soaring.
One significant difference: it isn’t automatically a reversal signal. You have to assess how price reacts after this area of liquidity is consumed- market structure, volume if relevant, levels on higher time-frames, etc.
This is to explain where liquidity comes from, and how these sweeps are formed, and to identify actual sweeps over fake ones as well as mistakes traders ought to take steps not to make.
Understanding Liquidity in Financial Markets
Before examining a sweep, it helps to understand what traders mean by liquidity.
Essentially liquidity is the readiness to buy and sell an asset through market liquidity and order placement. The more liquid the market, typically the higher volume of trading present, and higher numbers of readily available orders around the present market price can be, easing entrance or exiting positions. Liquidity can take several forms; limit orders standing on the order book are a case, and the importance of stop orders. This would be if the stop order turned into a market order based upon the price going past a certain point.
Technical traders often focus on areas where orders are likely concentrated. These areas may develop around:
- Recent swing highs
- Recent swing lows
- Equal highs
- Equal lows
- Previous session highs and lows
- Major support and resistance zones
- Range boundaries
- Psychological price levels
There could be a visible technical level not the saying there is plenty liquidity sitting there. This is an area that interests traders as traders usually place orders around such levels.
Why Order Clusters Matter
For example if traders could not get a stock above a level like $100. Traders may call that level an “area of resistance”. A few traders on the short side of a trade may use buy stop orders to cover them from above that level, while other breakout traders may enter trades just at or above that level.
The same concept can occur beneath support when sell-side orders are activated.
How a Liquidity Sweep Develops
A simple interpretation of a sweep is series, not single candles.
First the market forms a relatively defined high, low, or range bound. As the area becomes more visible, stops or pending orders could be placed at it.
Second, price trades towards the area. If there is enough order flow, price could be seen as trading “through” the level instead of just stopped at it. This could have induced stops and breakouts. This would offer some buying or selling pressure into price depending on the direction.
Third, price decides if price should be rejected or accepted into the level and beyond.
If price reverses very quickly back into the prior range, we call this a liquidity sweep followed by a rejection. If the price stays above (or below, respectively) and builds structure at that level, we call this a breakout.
This is arguably one of the most important aspects of liquidity based trading.
Buy-Side and Sell-Side Liquidity
Liquidity sweeps are commonly divided into two categories: buy-side liquidity and sell-side liquidity.
Buy-Side Liquidity
Buy-side liquidity is often discussed above previous highs.
To illustrate: suppose an asset establishes an intraday high at $150 before drifting down and trading at the $145 area. Those taking short positions might have buy stops placed slightly above $150. Some individuals might add breakout purchase orders at prices exceeding $150.
When the price spikes above $150 and hits stops, it’s taken out buy side liquidity above the high.
If price quickly bounces back down below $150, it can be said there was a buy side liquidity sweep.
The key indicator is that prices breached a high. After that the response is a key indicator.
Sell-Side Liquidity
Sell-side liquidity is commonly associated with areas below previous lows.
For example, if the stock drops to $80 and forms a clearly visible low, only to come all the way back to $85, those on the long side can enter stops below the $80 low, while other traders will sell-stop orders at price levels beneath $80.
If price later drops below $80, those orders can be triggered.
If the market quickly recovers and moves back above $80, traders may identify the event as a sell-side sweep.
Again, this does not automatically mean that price will rise. It simply describes what happened around the liquidity area.
Liquidity Sweep vs. Breakout
One of the most common sources of confusion is determining whether a move beyond a key level represents a sweep or a genuine breakout.
A breakout generally involves price moving through an established level and showing enough acceptance to remain beyond it. A sweep often involves a move through the level followed by rejection.
The distinction becomes clearer when traders examine several factors.
1. Where Price Closes
A candle that briefly trades beyond a level but closes back inside the previous range can suggest rejection.
By contrast, repeated closes beyond the level may indicate stronger acceptance.
2. What Happens Next
The candles immediately following the move can provide useful context.
A rapid reversal may support the sweep interpretation. Continued directional movement can suggest that the market is actually breaking through the level.
3. Market Structure
A sweep should be evaluated within the broader structure.
For example, if a market is making higher highs and higher lows, a temporary move below a minor low may have a different meaning than a sweep occurring during a prolonged downtrend.
4. Higher-Timeframe Context
A five-minute liquidity event near a major daily resistance level may carry different significance from the same pattern occurring in the middle of a larger trading range.
This is why experienced traders often avoid analyzing a sweep in isolation.
Where Traders Commonly Find Liquidity
Liquidity can develop almost anywhere, but some chart locations attract more attention than others.
Equal Highs and Equal Lows
When two or more highs form around a similar price, traders may see the area as a clear resistance zone. The same applies to repeated lows.
These levels are visually obvious, which can make them useful reference points for studying potential liquidity behavior.
Previous Day High and Low
The previous trading session’s high and low are widely watched by many market participants. Because these levels are visible and easy to define, they can become important reference points for intraday traders.
Range Highs and Lows
Markets often move sideways between established boundaries. Traders may watch both edges of the range for potential breaks, failed breaks, or continuation moves.
A move outside the range followed by a rapid return inside can provide valuable information about short-term market behavior.
Swing Points
Recent swing highs and lows are another common source of interest. These points often represent locations where traders previously entered, exited, or placed protective orders.
Not every swing point contains significant liquidity. Context remains essential.
How to Analyze a Potential Sweep Step by Step
A structured process can reduce emotional decisions.
Step 1: Identify the Market Structure
Start with the larger picture. Determine whether the market is generally trending upward, trending downward, or moving sideways.
You do not need to predict the entire market. The goal is simply to establish context.
Step 2: Mark Important Highs and Lows
Identify obvious swing points, equal highs, equal lows, range boundaries, and significant session levels.
Avoid marking every tiny fluctuation. Too many levels can make the chart difficult to interpret.
Step 3: Watch How Price Approaches the Level
The approach itself can contain information.
A slow grind toward a high may behave differently from a sharp momentum-driven move. Neither guarantees a particular outcome, but the surrounding price action can help traders understand the situation.
Step 4: Observe the Level Being Tested
Watch whether price trades beyond the high or low.
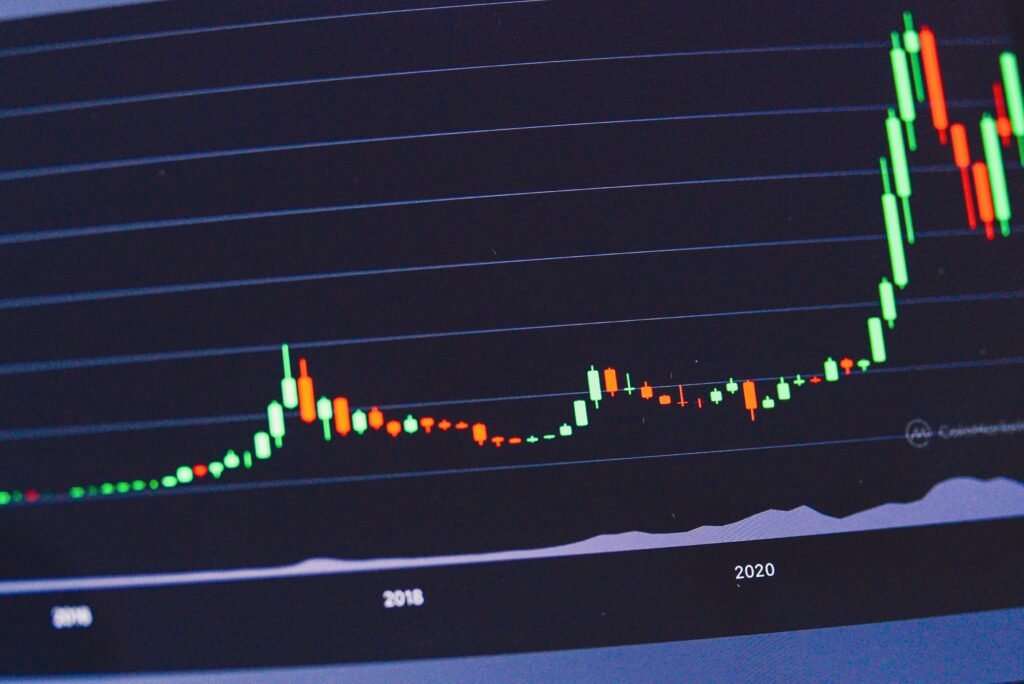
A wick beyond a level can be meaningful, but the candle’s close and subsequent price behavior matter more than the wick alone.
Step 5: Wait for Confirmation
Rather than entering immediately because a level was breached, traders can wait to see whether the market rejects or accepts the area.
Possible confirmation might include a return inside the previous range, a change in short-term market structure, or sustained movement beyond the level.
Step 6: Define Risk Before Entering
If a trade is being considered, determine where the setup becomes invalid before placing the order.
Risk management should not be decided after the position starts moving against you.
Step 7: Review the Trade Objectively
After the setup is complete, review whether the original reasoning was valid. A losing trade does not necessarily mean the analysis was poor, and a winning trade does not automatically prove the analysis was correct.
The goal is to improve the decision-making process.
Common Mistakes Traders Make
Liquidity concepts can be useful, but they are frequently misunderstood.
Treating Every Wick as a Sweep
A long wick does not automatically represent a liquidity event.
Price can produce long wicks because of volatility, news, thin liquidity, profit-taking, or ordinary market fluctuations.
The surrounding structure matters.
Assuming Every Sweep Must Reverse
This is perhaps the most dangerous misconception.
A market can move beyond a previous high, trigger orders, and then continue higher. Likewise, it can break below a previous low and continue falling.
A sweep is an observation about price behavior, not a guaranteed forecast.
Ignoring the Higher-Timeframe Trend
A short-term setup may look convincing until viewed on a larger chart.
For instance, a trader can spot a bearish rejection in a five-minute chart but the daily market still favors buying strong as hell. It does not rule out a short trading signal but it adjusts risk.
Entering Too Early
Some traders see price touch or cross a level and immediately enter.
That approach can be problematic because the market has not yet shown whether the level will be rejected or accepted.
Waiting for confirmation can reduce the number of premature entries, although it cannot eliminate losses.
Using Too Many Indicators
Liquidity analysis does not require a chart covered with indicators.
Adding more tools does not necessarily lead to better decisions.A cleaner chart with well-defined levels and clear market structure can sometimes be easier to interpret.
Special Cases to Consider
Not every market behaves in the same way.
Major Economic News
Major economic announcements can dramatically change financial market liquidity conditions.
There can be very quick market moves following releases of data or events. These can include rates decisions, inflation releases, employment numbers, corporate results, and other significant data. Around such data a level may have been taken out swiftly, the spread may have widened, and what looked like a perfect sweep post-mortem could have actually happened only due to that release.
Low-Liquidity Markets
Thinly traded assets can experience exaggerated price movements. A temporary move through a high or low may occur without the same order-flow dynamics traders expect in a deeper market.
Liquidity concepts should therefore be adapted to the asset being analyzed.
Cryptocurrency Markets
Trading volumes are spread across many venues – and how that volume and thus liquidity may be distributed can also vary across exchanges. One zone on one particular chart may not exist exactly like that on the other.
Traders should understand which market or exchange their chart represents.
Futures and Forex
Futures markets and Forex trading also have a specific trading hours, session nature and liquidity conditions. Level found in one session might not have the same value in another. Level formed and its impact to the instrument depends on market nature.
Aware of the sweep, as well as aware of the nature of the financial instrument being traded, are equally significant to your process.
Risk Management Matters More Than the Pattern
A liquidity sweep should never replace basic risk management.
Even a well-defined setup can fail. Price may move through a level, reject it, and then unexpectedly reverse again. Markets are uncertain, and no chart pattern can remove that uncertainty.
A sensible trading plan should define:
- How much capital is at risk on a trade
- Where the trade becomes invalid
- What market conditions cancel the setup
- How position size is calculated
- Whether the expected reward justifies the potential loss
Risk should be determined before entering rather than adjusted emotionally afterward.
Traders should also be careful with leverage. Leverage can magnify both gains and losses, making a small adverse movement much more significant.
How to Improve Liquidity Sweep Analysis
Better analysis usually comes from combining several pieces of information instead of relying on one pattern.
Start with market structure. Then identify important liquidity areas. After that, observe how price interacts with those areas.
A trading journal is also a good tool. In it, you should track setup screenshots, reason for entry, market conditions, trigger signals and the result. This helps over time identify if the actual setup is doing very well given the conditions you are trading under.
You can do so via backtesting or paper trading, and see how the strategy performs under real life conditions.
But most importantly, don’t turn it into a rigid formula for nothing really happens in the market because a certain pattern has shown up. The sweep is just another ingredient within an already complex recipe.
Final Takeaway
Understanding what is a liquidity sweep in trading starts with recognizing that price often interacts with visible highs, lows, and other areas where orders may be concentrated. A move beyond one of these levels can trigger stops and pending orders before the market either rejects the move or accepts the new price area.
The most rewarding approach: analyze the whole sequence (market structure, liquidity location, the level being tested, how market reacted afterward, time frame involved). This means a sweep is not necessarily a trading setup, or an auto-reverse pattern. It requires risk management, confirmation and execution. By seeing a sweep as part of your overall price-action, you don’t take it as an isolated setup and have a more balanced view towards the price-action.
FAQs About What Is a Liquidity Sweep in Trading
1. What Is a Liquidity Sweep in Trading?
A liquidity sweep occurs when price moves beyond an obvious high, low, or other visible market level where orders may be clustered, then reverses or reacts around that area. Traders use the subsequent price action to determine whether the move was a failed breakout or a genuine continuation.
2. How do you identify a liquidity sweep?
Look for a clear swing high, swing low, equal high, equal low, or range boundary. If price briefly moves beyond that level and then returns back inside the previous structure, the setup may represent a sweep. The reaction after the level is taken is more important than the initial price spike.
3. Is a liquidity sweep the same as a breakout?
No. A genuine breakout typically shows acceptance beyond the previous level, while a sweep is commonly associated with a move through the level followed by rejection. The distinction cannot always be known immediately, so traders often wait for the candle close and subsequent market structure before making a judgment.
4. Does every liquidity sweep lead to a reversal?
No. A sweep does not guarantee that price will reverse. Price can move beyond a high or low and continue trending. The idea should therefore be treated as a price-action observation rather than a guaranteed reversal signal.
5. What is a buy-side liquidity sweep?
A buy-side sweep occurs when price moves above a visible high where buy orders may be concentrated. This can include stop-loss orders from short positions and breakout orders. If price then falls back below the level, traders may interpret the move as a potential bearish liquidity event.
6. What is a sell-side liquidity sweep?
A sell-side sweep occurs when price moves below a visible low where sell orders may be concentrated. If the market subsequently recovers above that level, traders may view the move as a potential bullish liquidity event. The broader market structure still needs to be considered.
7. Where does liquidity commonly form?
Common areas include previous swing highs and lows, equal highs and lows, range boundaries, and other highly visible price levels. These areas can attract orders because many traders use similar technical reference points.
Conclusion
Understanding what is a liquidity sweep in trading can help traders make better sense of sudden moves through obvious highs, lows, and range boundaries. At its core it is about the price hitting an area where orders could be grouped then deciding if the market rejects prices above or below that zone. A sweep is not necessarily conclusive of institutions hunting retail traders nor should every wick signify a reversal set up. Combining the liquidity zone with market structure, timeframe, confirmation and careful risk-taking remains the most robust trade analysis methodology.